research
Abstracts and selected figures from published/accepted papers, working drafts, and in-progress projects…
And here’s my CV (also as PDF).
published/accepted
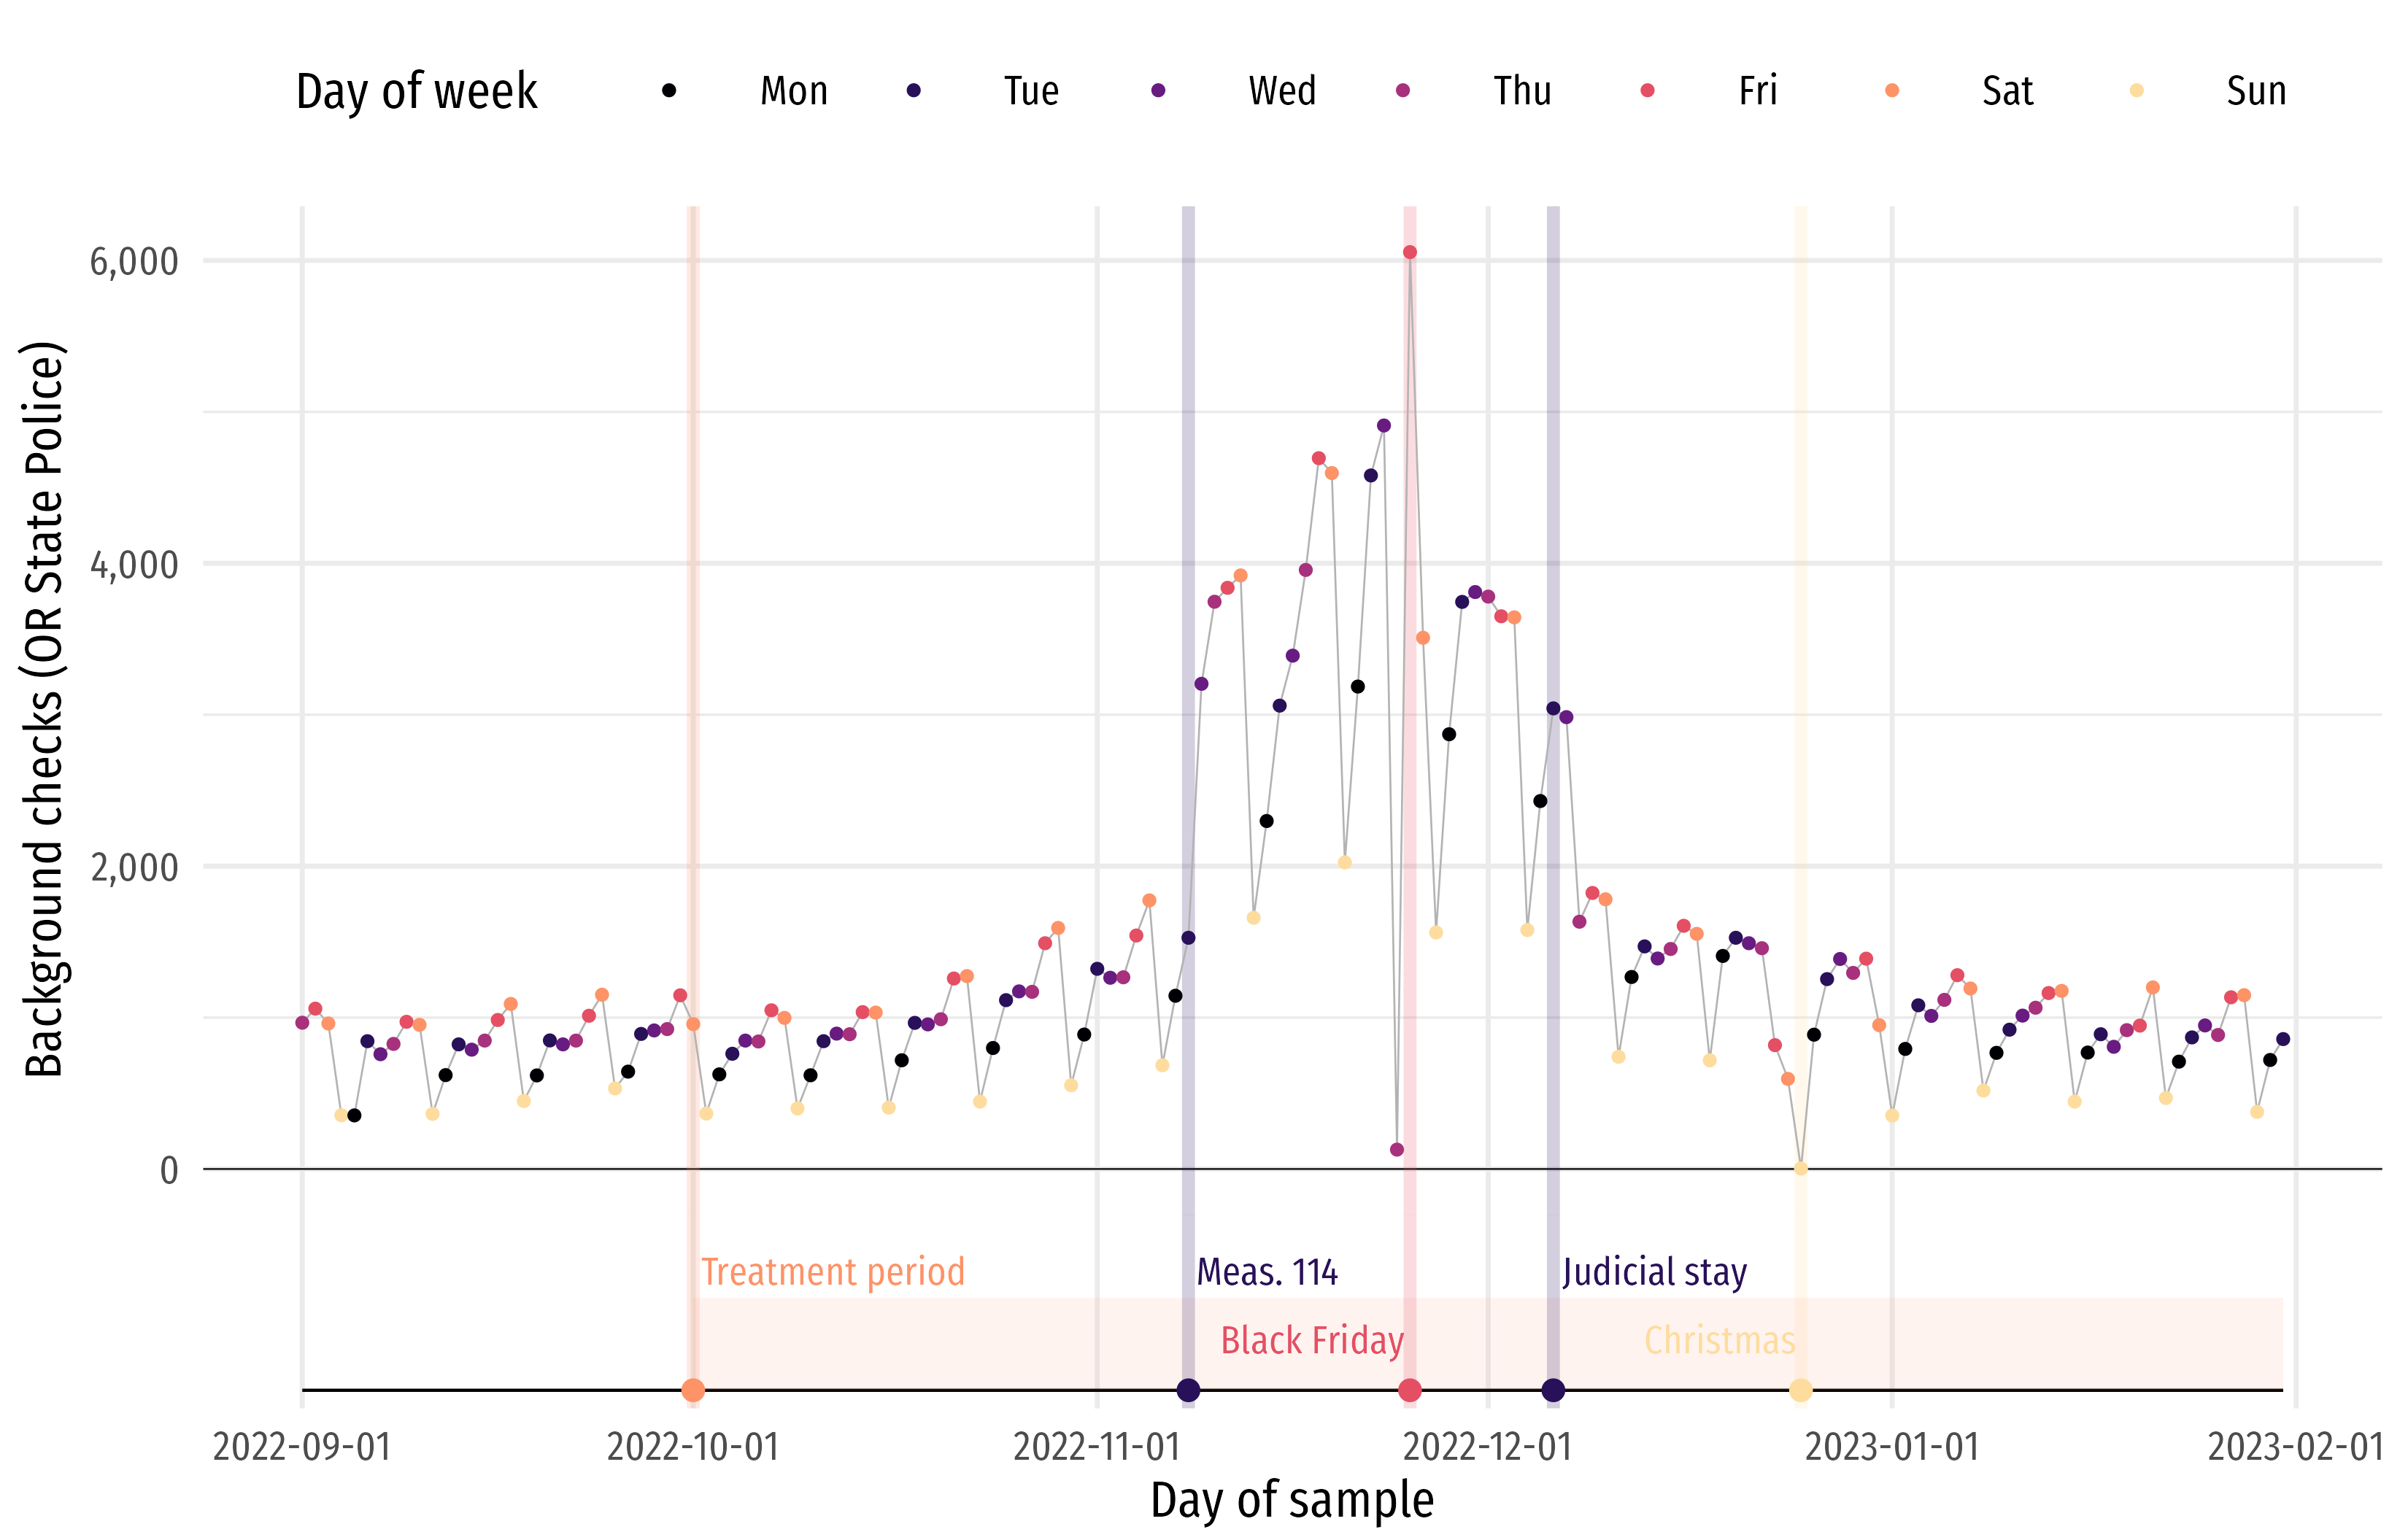
Gun policy and the steel paradox
Katie Bollman, Benjamin Hansen, Edward Rubin, and Garrett Stanford
Accepted, Journal of Public Economics
We study the dynamic effects of newly-passed gun legislation on the demand for firearms. We focus on Oregon, where voters affirmed Measure 114 in November of 2022—narrowly passing with 50.7 percent of the vote. In the six weeks following the vote, background checks surged by 400 percent. After a judge’s decision prevented the law from immediate enactment, background checks fell but remained 100 percent higher than pre-legislation levels—even five months after the original vote.
NBER Working Paper No. 33360 | Current draft
Coverage: NPR
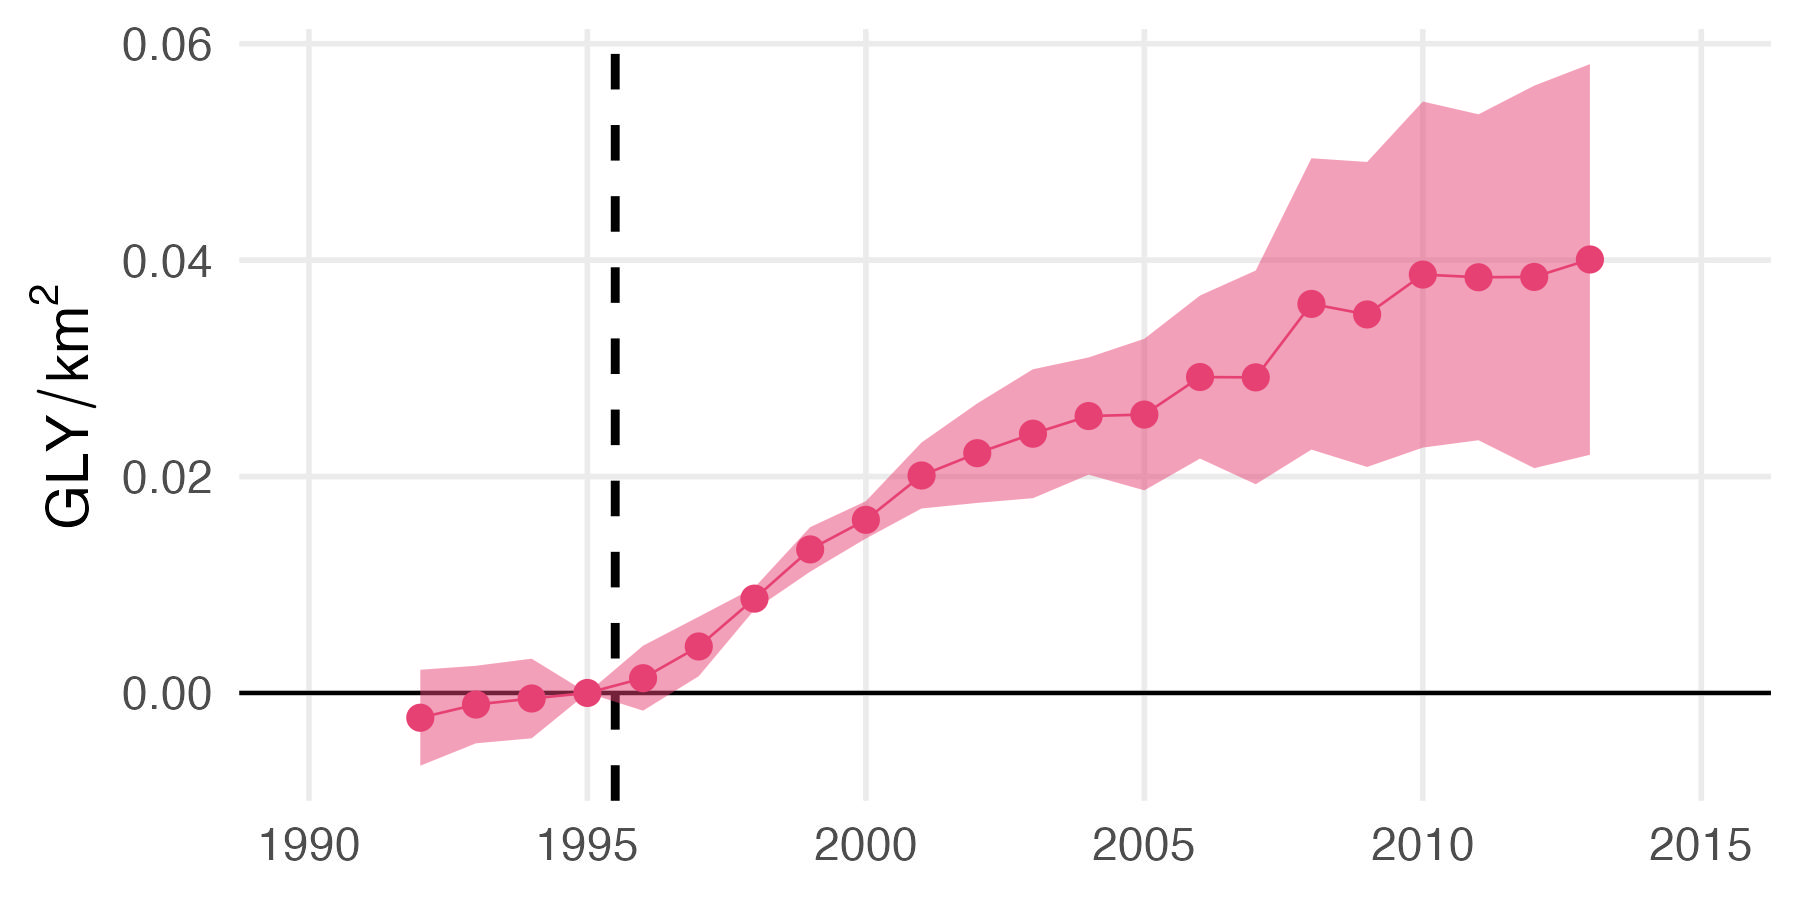
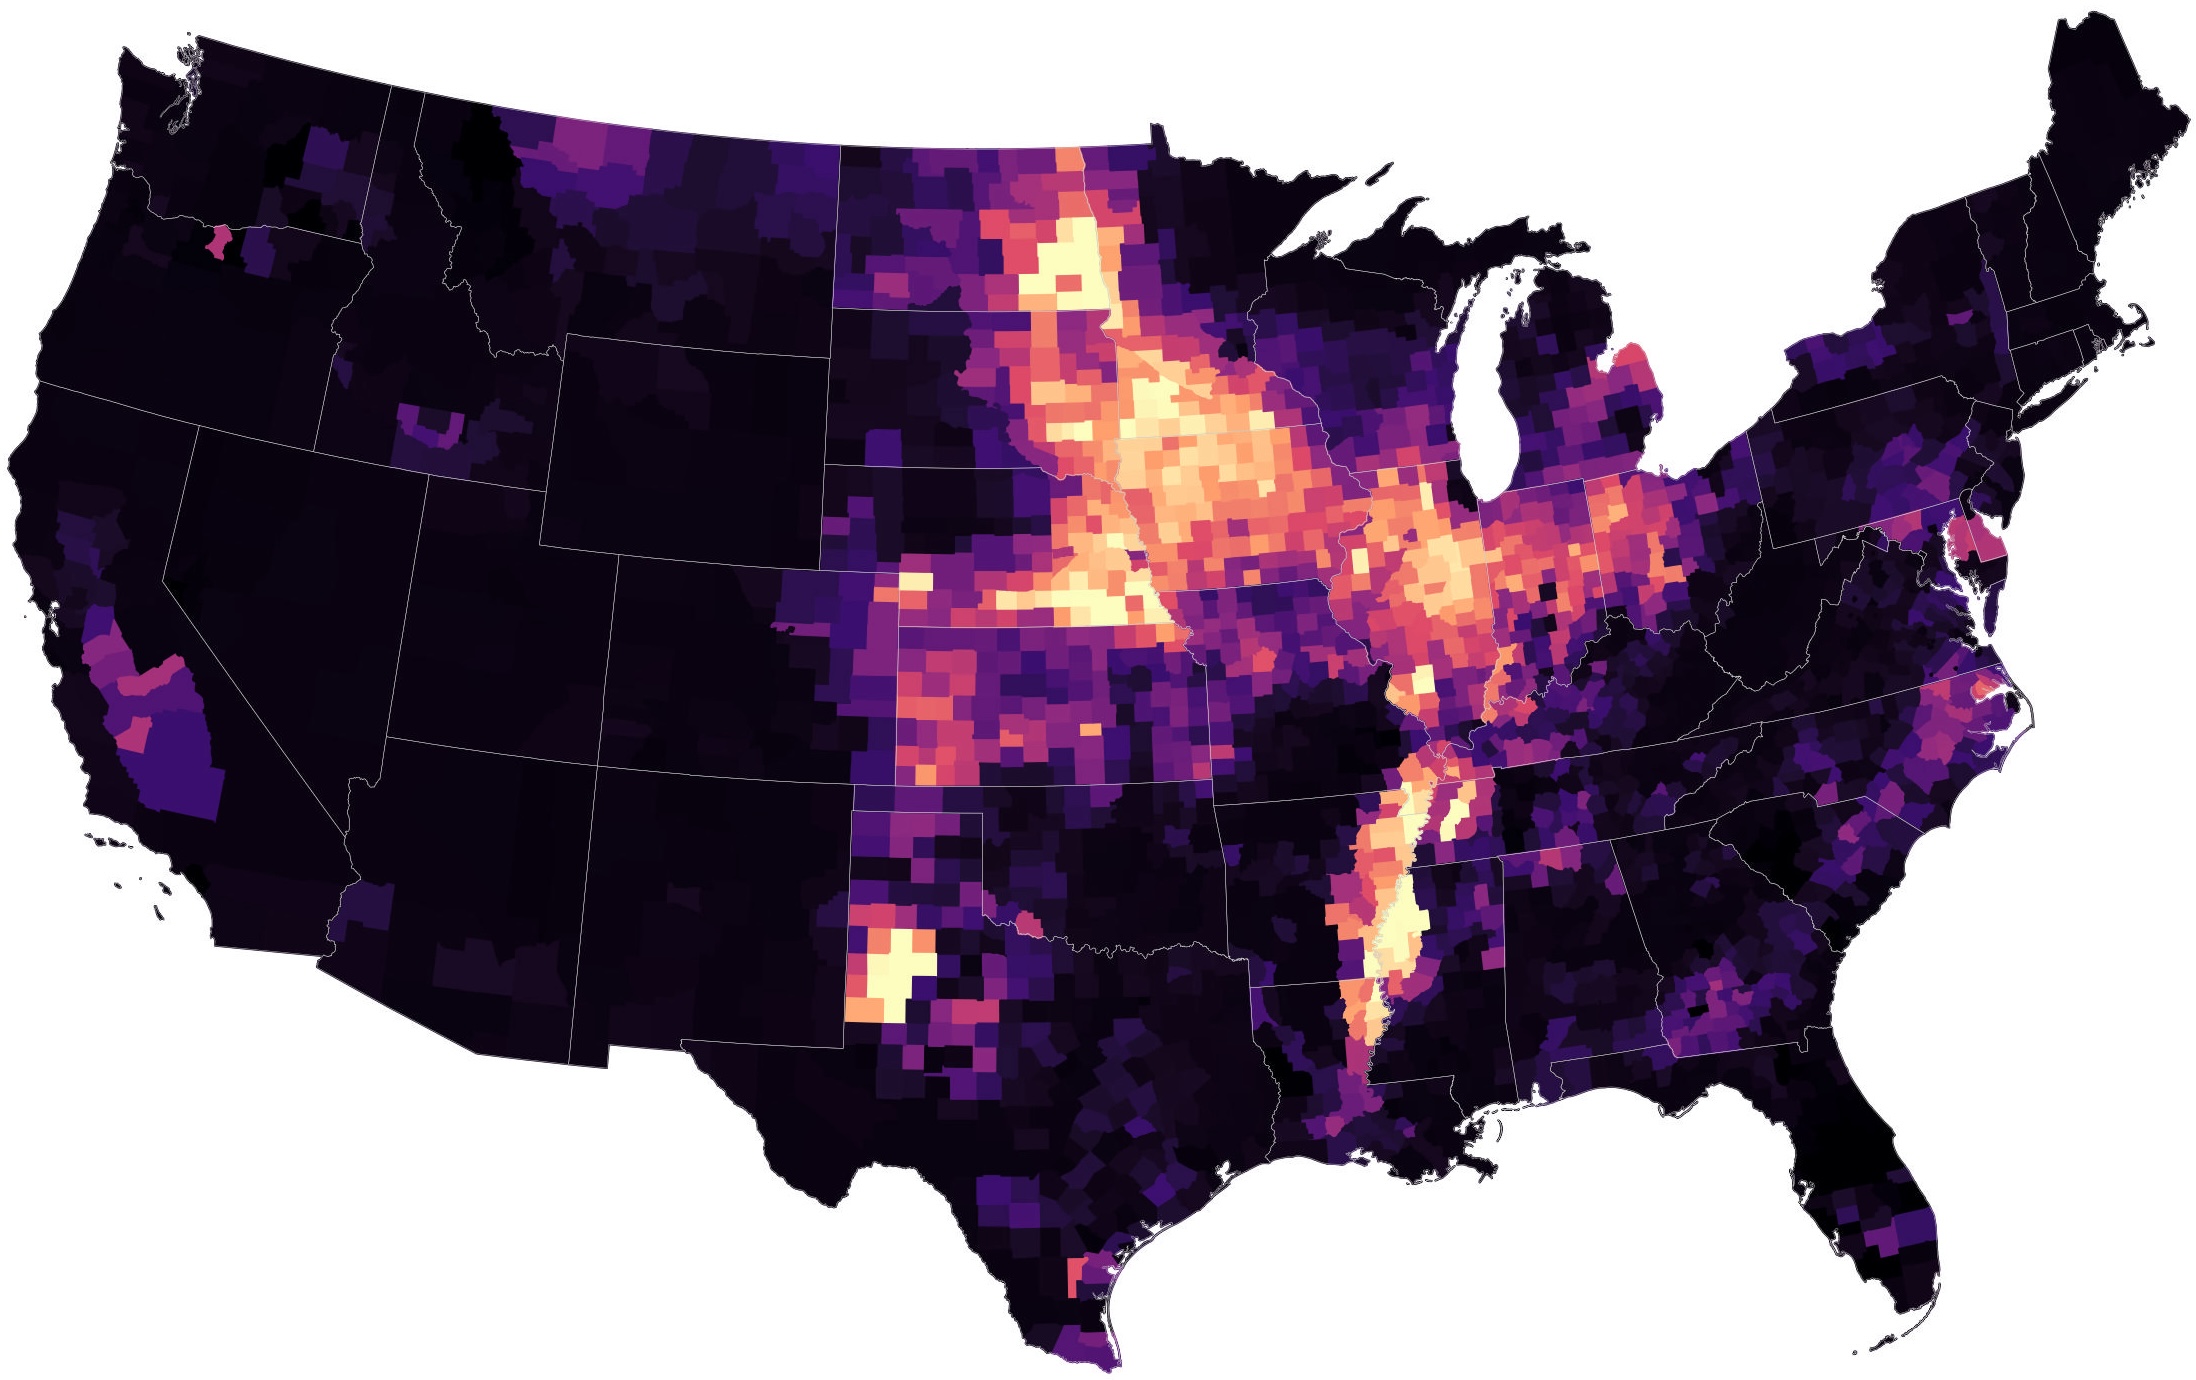
Glyphosate exposure and GM seed rollout unequally reduced perinatal health
Emmett Saulnier and Edward Rubin. 2025. Proceedings of the National Academy of Sciences (USA). 122(3). DOI: 2413013121
The advent of herbicide-tolerant genetically modified (GM) crops spurred rapid and widespread use of the herbicide glyphosate (GLY) throughout US agriculture. In the two decades following GM-seed’s introduction, the volume of GLY applied in the US increased by more than 750%. Despite its breadth and scale, science and policy remain unresolved regarding the effects of GLY on human health. We identify the causal effect of GLY exposure on perinatal health by combining (1) county-level variation in GLY use driven by (2) the timing of the GM technology and (3) differential geographic suitability for GM crops. Our results suggest the introduction of GM seeds and GLY significantly reduced average birthweight and gestational length. While we find effects throughout the birthweight distribution, low-weight births experienced the largest reductions: the effect for births in the lowest decile is 4.5 times larger than that of the highest decile. Together, these estimates suggest that GLY exposure caused previously undocumented and unequal health costs for rural US communities over the last 20 years.

Coverage: Science | Newsweek | Washington Post | OPB (Audio: Apple Podcasts) | UO News | Vox | US Right to Know
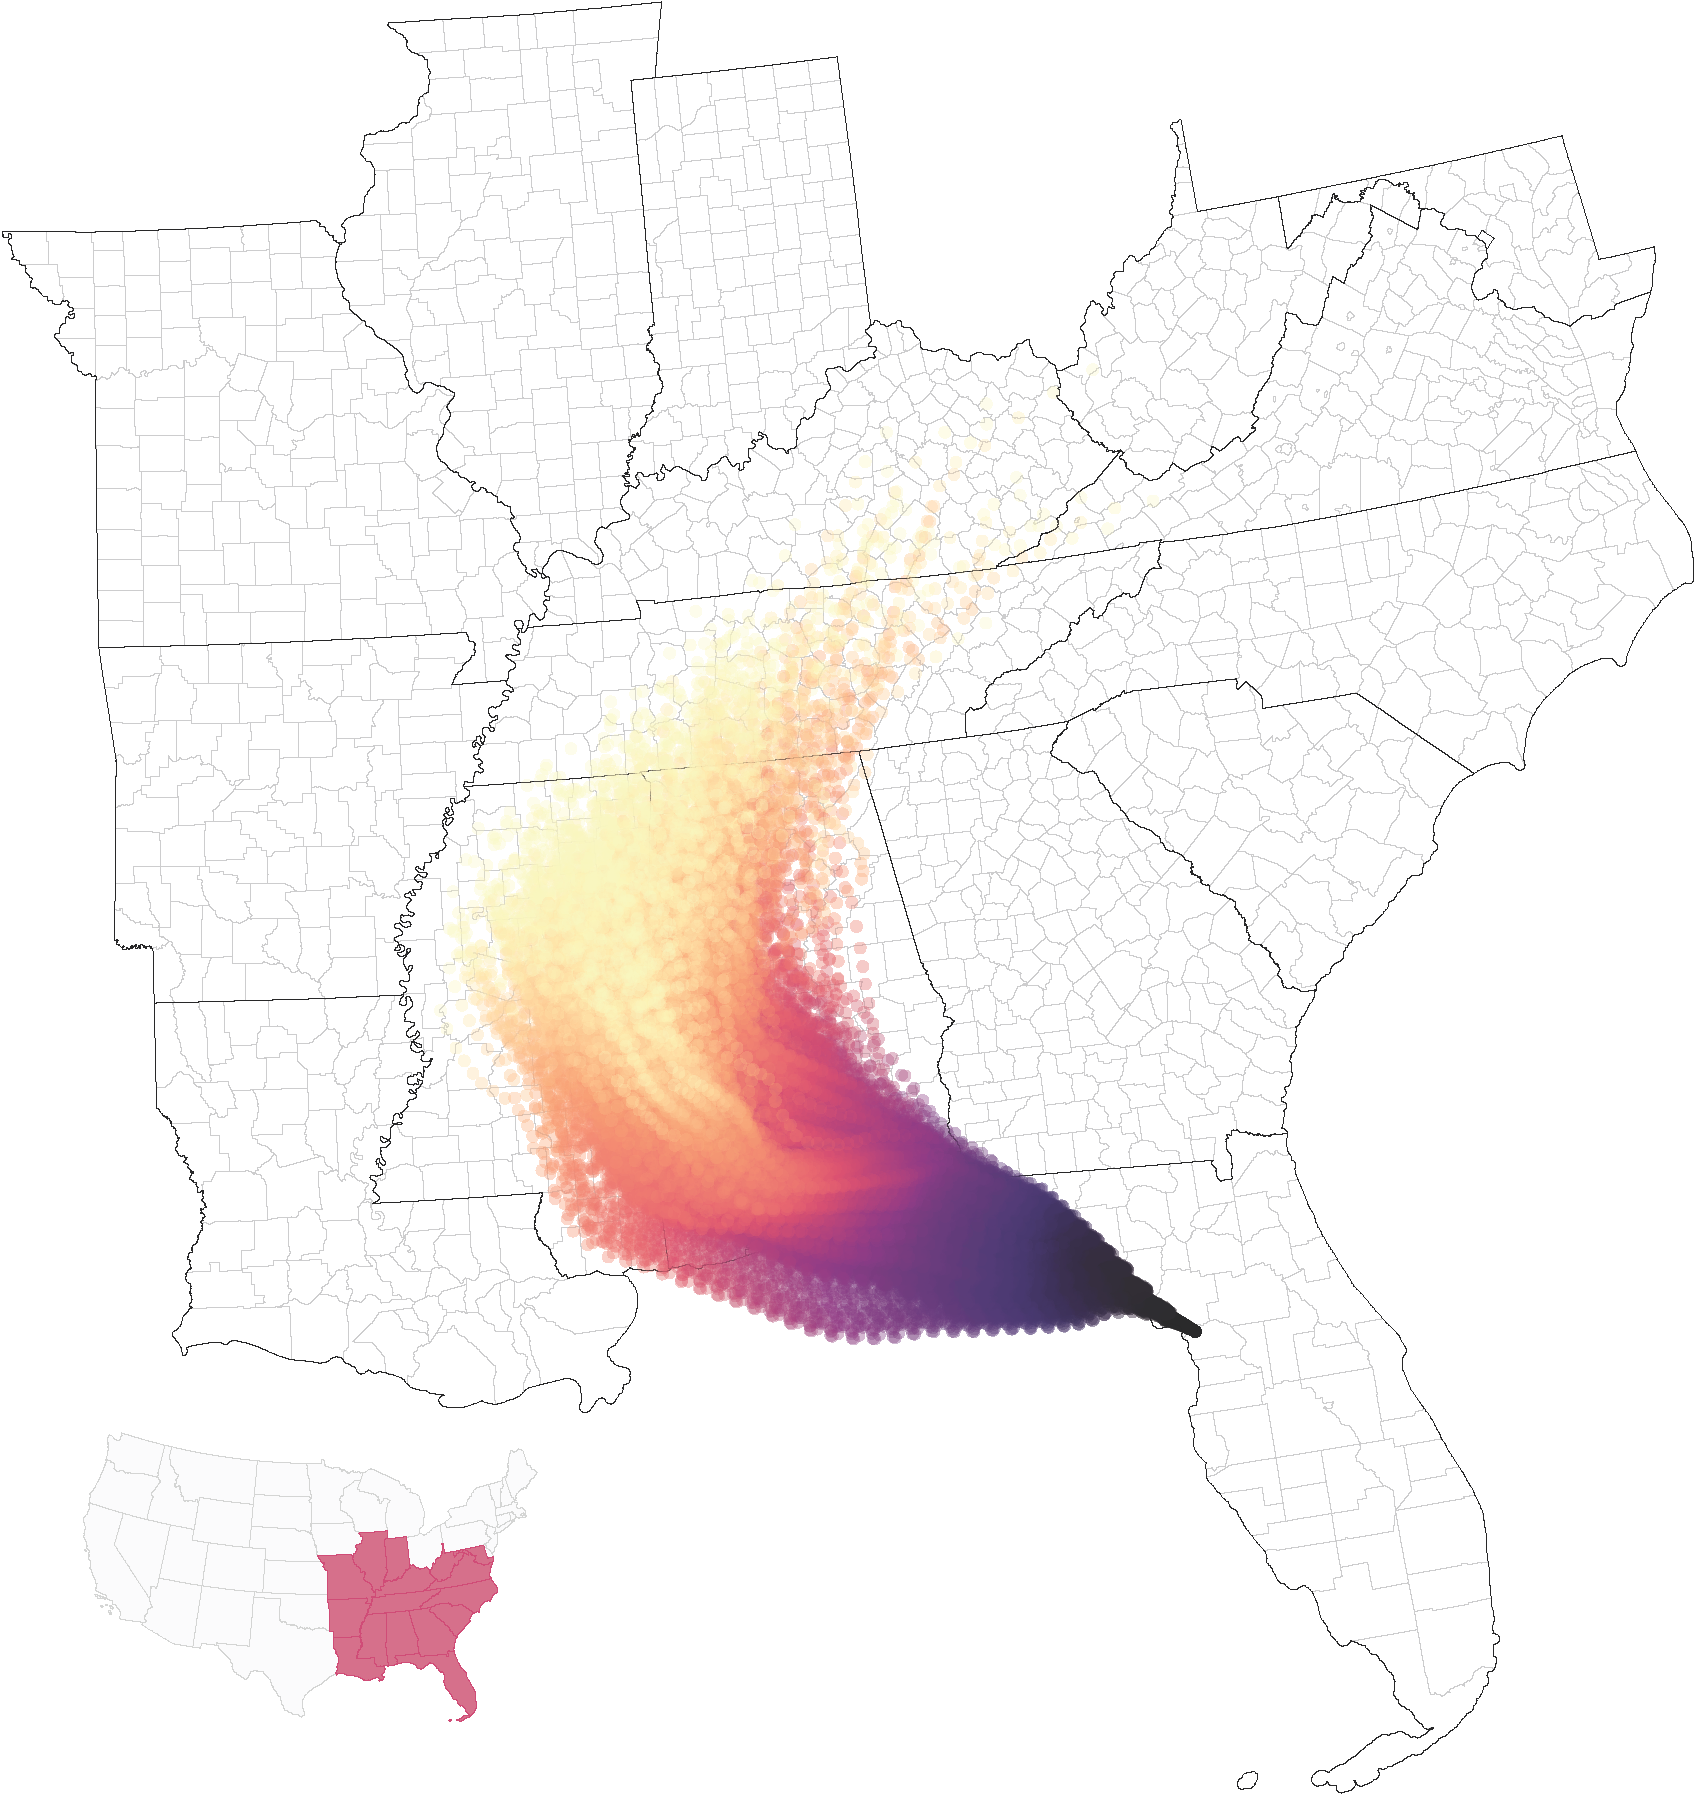
Downwind and out: The strategic dispersion of power plants and their pollution
John Morehouse and Edward Rubin. 2025. Journal of the Association of Environmental and Resource Economists. DOI: 10.1086/740146
Replication materials: GitHub | Harvard Dataverse: 10.7910/DVN/NSCJG9
US environmental policy cedes substantial authority to local agencies—creating potentials for polluters/governments to strategically export emissions. We identify such strategies among coal-fueled power plants. First, we document that electricity generators locate near administrative borders. As water influences borders/siting, we develop a simple, non-parametric test that shows coal plants located to reduce downwind exposure. Natural-gas plants—facing lower regulatory pressure—do not exhibit this behavior. Using a state-of-the-art, particle-trajectory model, we illustrate coal pollution’s extreme mobility: within 6 hours, 50% of coal plants’ emissions leave their source states—99% depart source counties. These strategic responses emphasize the importance of federal oversight and transport-focused regulation.
Customer Discrimination in the Workplace: Evidence from Online Sales
Erin Kelley, Gregory Lane, Matthew Pecenco, and Edward Rubin. 2025. Journal of Labor Economics. DOI: 10.1086/733049
Many workers are evaluated on their ability to engage with customers. This paper measures the impact of gender-based customer discrimination on the productivity of online sales agents working across Sub-Saharan Africa. Using a novel framework that randomly varies the gender of names presented to customers without changing worker behavior, we find that the assignment of a female-sounding name leads to 50 percent fewer purchases by customers. The results appear to be driven by relatively lower interest in engaging with female workers. Since worker productivity informs firm hiring, pay, and promotion decisions, these results are important for understanding the persistence of identity-based discrimination in the labor market.
NBER Working Paper No. 31998 | Becker Friedman Institute Working Paper No. 2023-25 | World Bank Policy Research Working Paper No. 10228 | Draft
Coverage: VoxDev | J-PAL | BFI
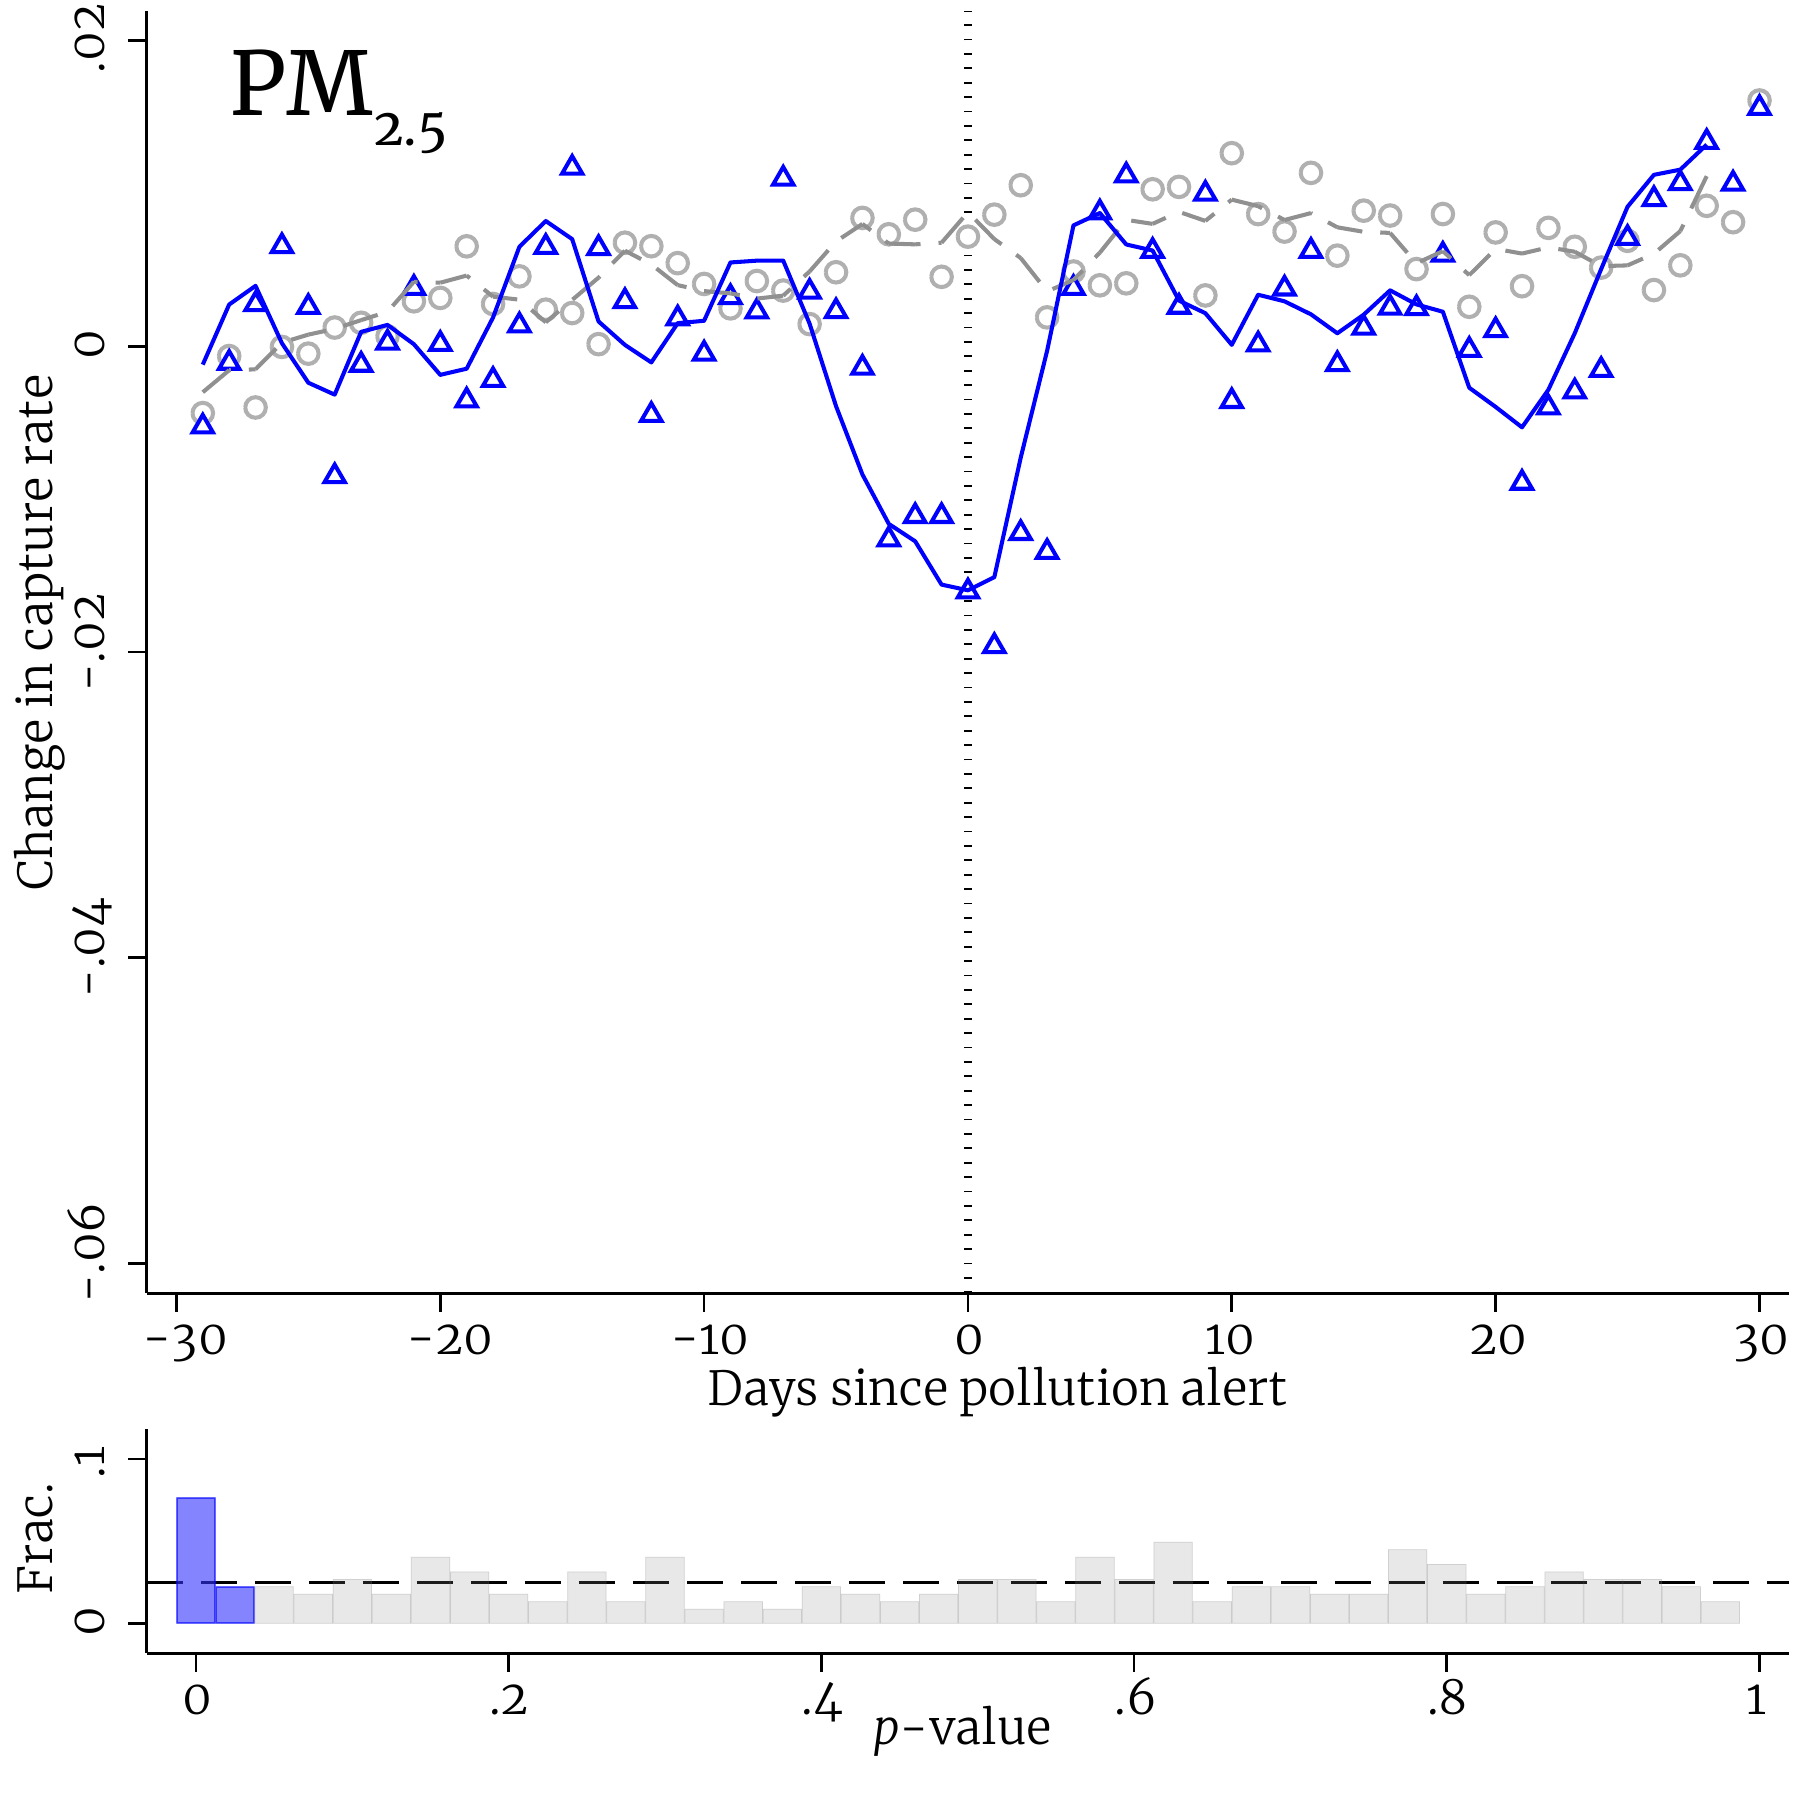
Yingfei Mu, Edward Rubin, and Eric Zou. 2024. The Review of Economics and Statistics. DOI: 10.1162/rest_a_01477
Tolerance for gaps in compliance (self-)monitoring data may induce strategic timing in local agents’ monitoring activity. This paper builds a framework to detect whether local governments skip air pollution monitoring when they expect air quality to deteriorate. We infer this expectation from air quality alerts—public advisories based on local governments’ own pollution forecasts—and test whether monitors’ sampling rates fall when these alerts occur. We first use this method to test an individual pollution monitor in Jersey City, NJ, suspected of a deliberate shutdown during the 2013 “Bridgegate” traffic jam. Consistent with strategic shutdowns, this monitor’s sampling rate drops by 33% on pollution-alert days. Building on large-scale inference tools, we then apply the method to test over 1,300 monitors across the U.S., finding 14 metro areas with clusters of monitors showing similar strategic behavior. We discuss imputation methods and policy responses that may help deter future strategic monitoring.
NBER Working Paper No. 28735 | Pre-print version
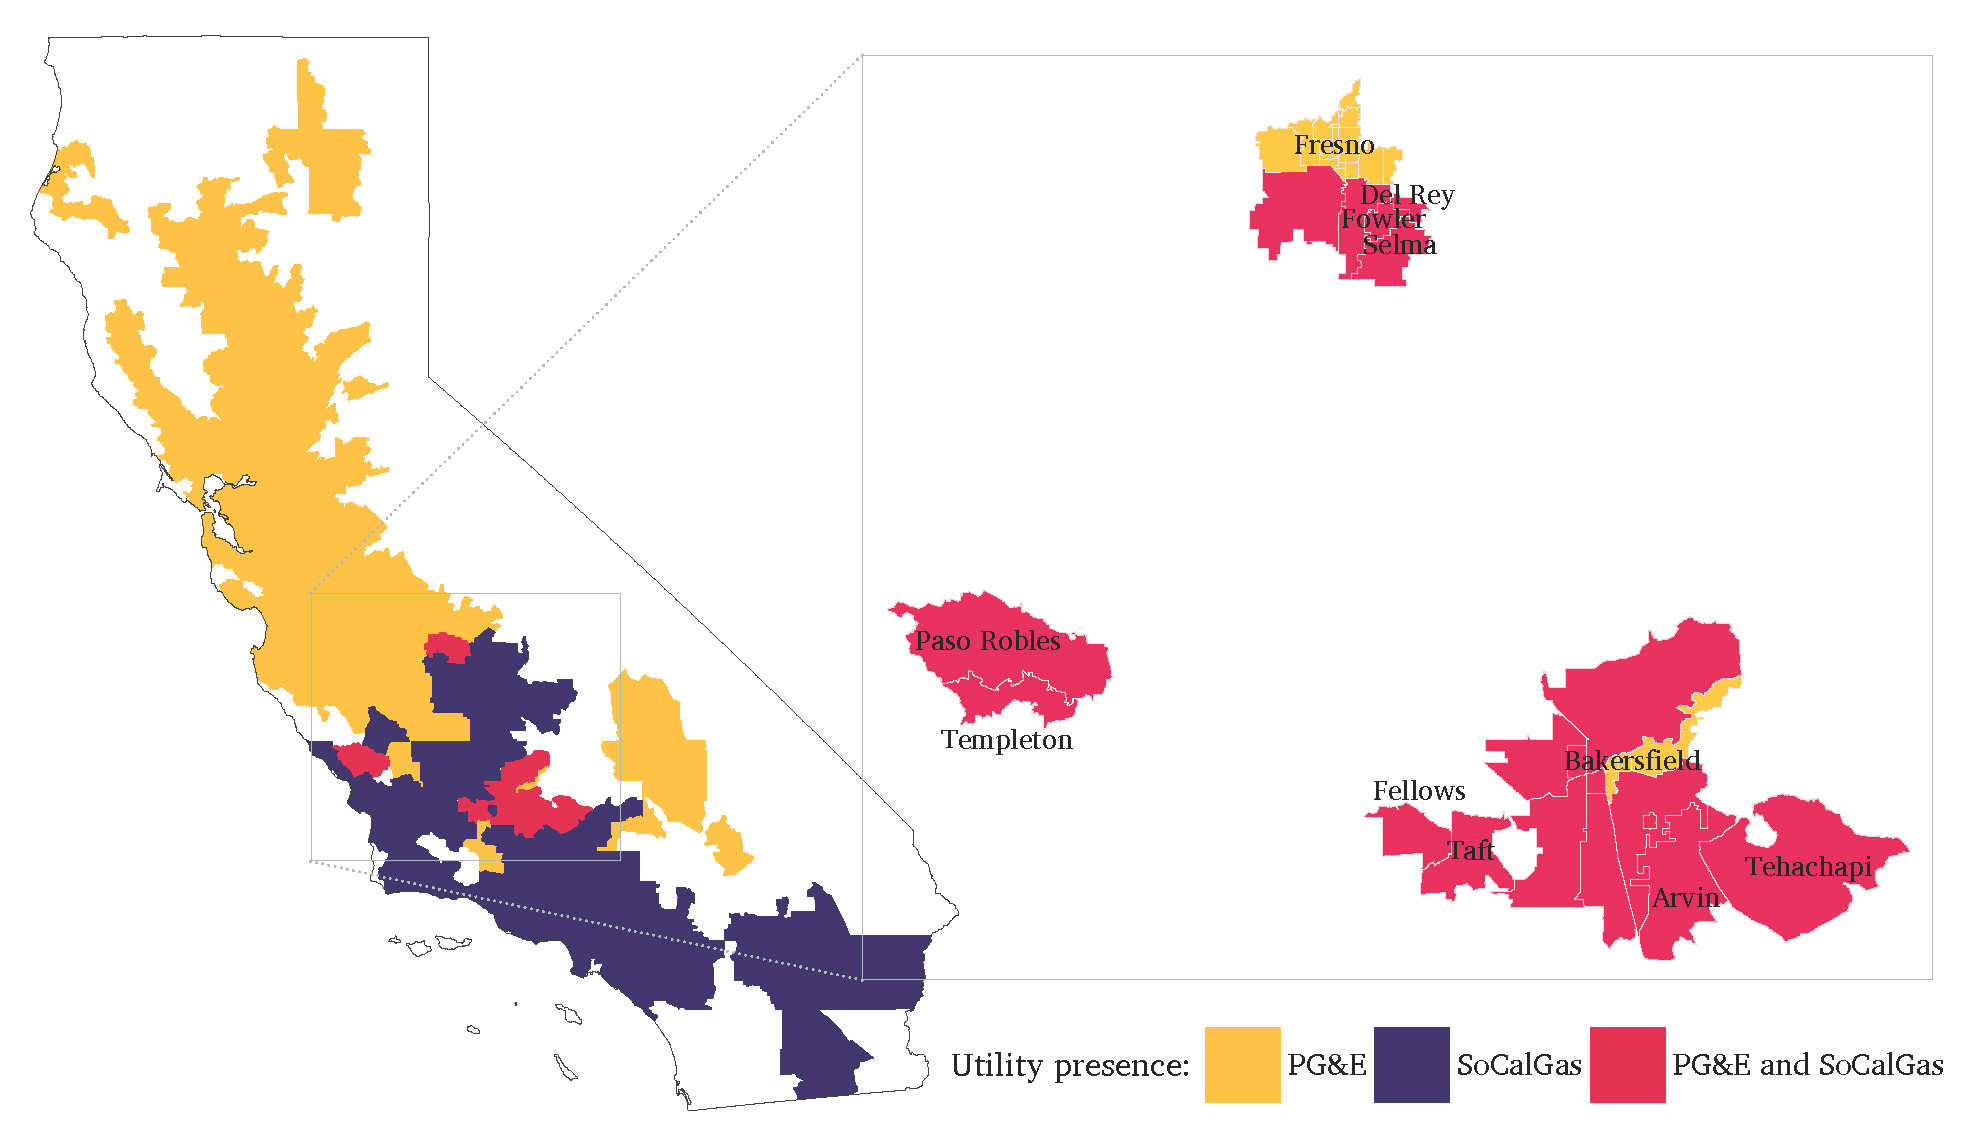
Quantifying heterogeneity in the price elasticity of residential natural gas
Edward Rubin and Maximilian Auffhammer. 2024. Journal of the Association of Environmental and Resource Economists, 11(2). DOI: 10.1086/726017
Replication code: Harvard Dataverse
We exploit a spatial discontinuity in two natural gas utilities’ service territory—combined with variation in their block-rate pricing structure and a difference in how prima facie determined wholesale prices are deferentially passed though to consumers—to identify average, seasonal, and income-specific own-price elasticities of residential natural gas demand. We estimate an average elasticity ranging from 0.15–0.19 depending on the measure of price used. We further estimate that this elasticity varies substantially across seasons, income groups, and their interaction. We find no significant difference in consumers’ responses to average versus marginal prices.
NBER Working Paper No. 24295 | EI @ Haas Working Paper 287
Coverage: The Economist
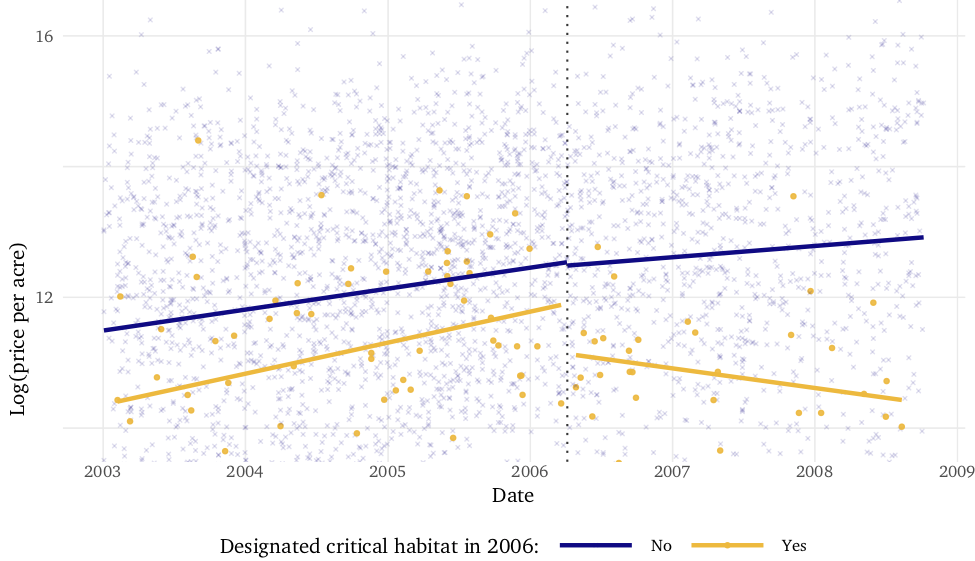
The economic impact of critical-habitat designation: Evidence from vacant-land transactions
Maximilian Auffhammer, Maya Duru, Edward Rubin, and David L. Sunding. 2020. Land Economics, 96(2), 188–206. DOI: 10.3368/le.96.2.188
The Endangered Species Act (ESA) requires the federal government to designate critical habitat for species listed as threatened or endangered. This provision of the ESA has proven to be one of its most controversial, as critical-habitat land designation entails special management—and potentially greater regulation. In this paper we measure the economic impact of critical-habitat designation by estimating its effect on the market value of vacant land. Using data from over 13,000 vacant-land transactions that occurred within or near critical habitat for two important species in California (red-legged frog and Bay checkerspot butterfly), we show that critical-habitat designation resulted in a large and statistically significant decrease in land value. The estimated impact of critical-habitat designation is heterogeneous: the largest decreases occur within designated urban-growth boundaries.
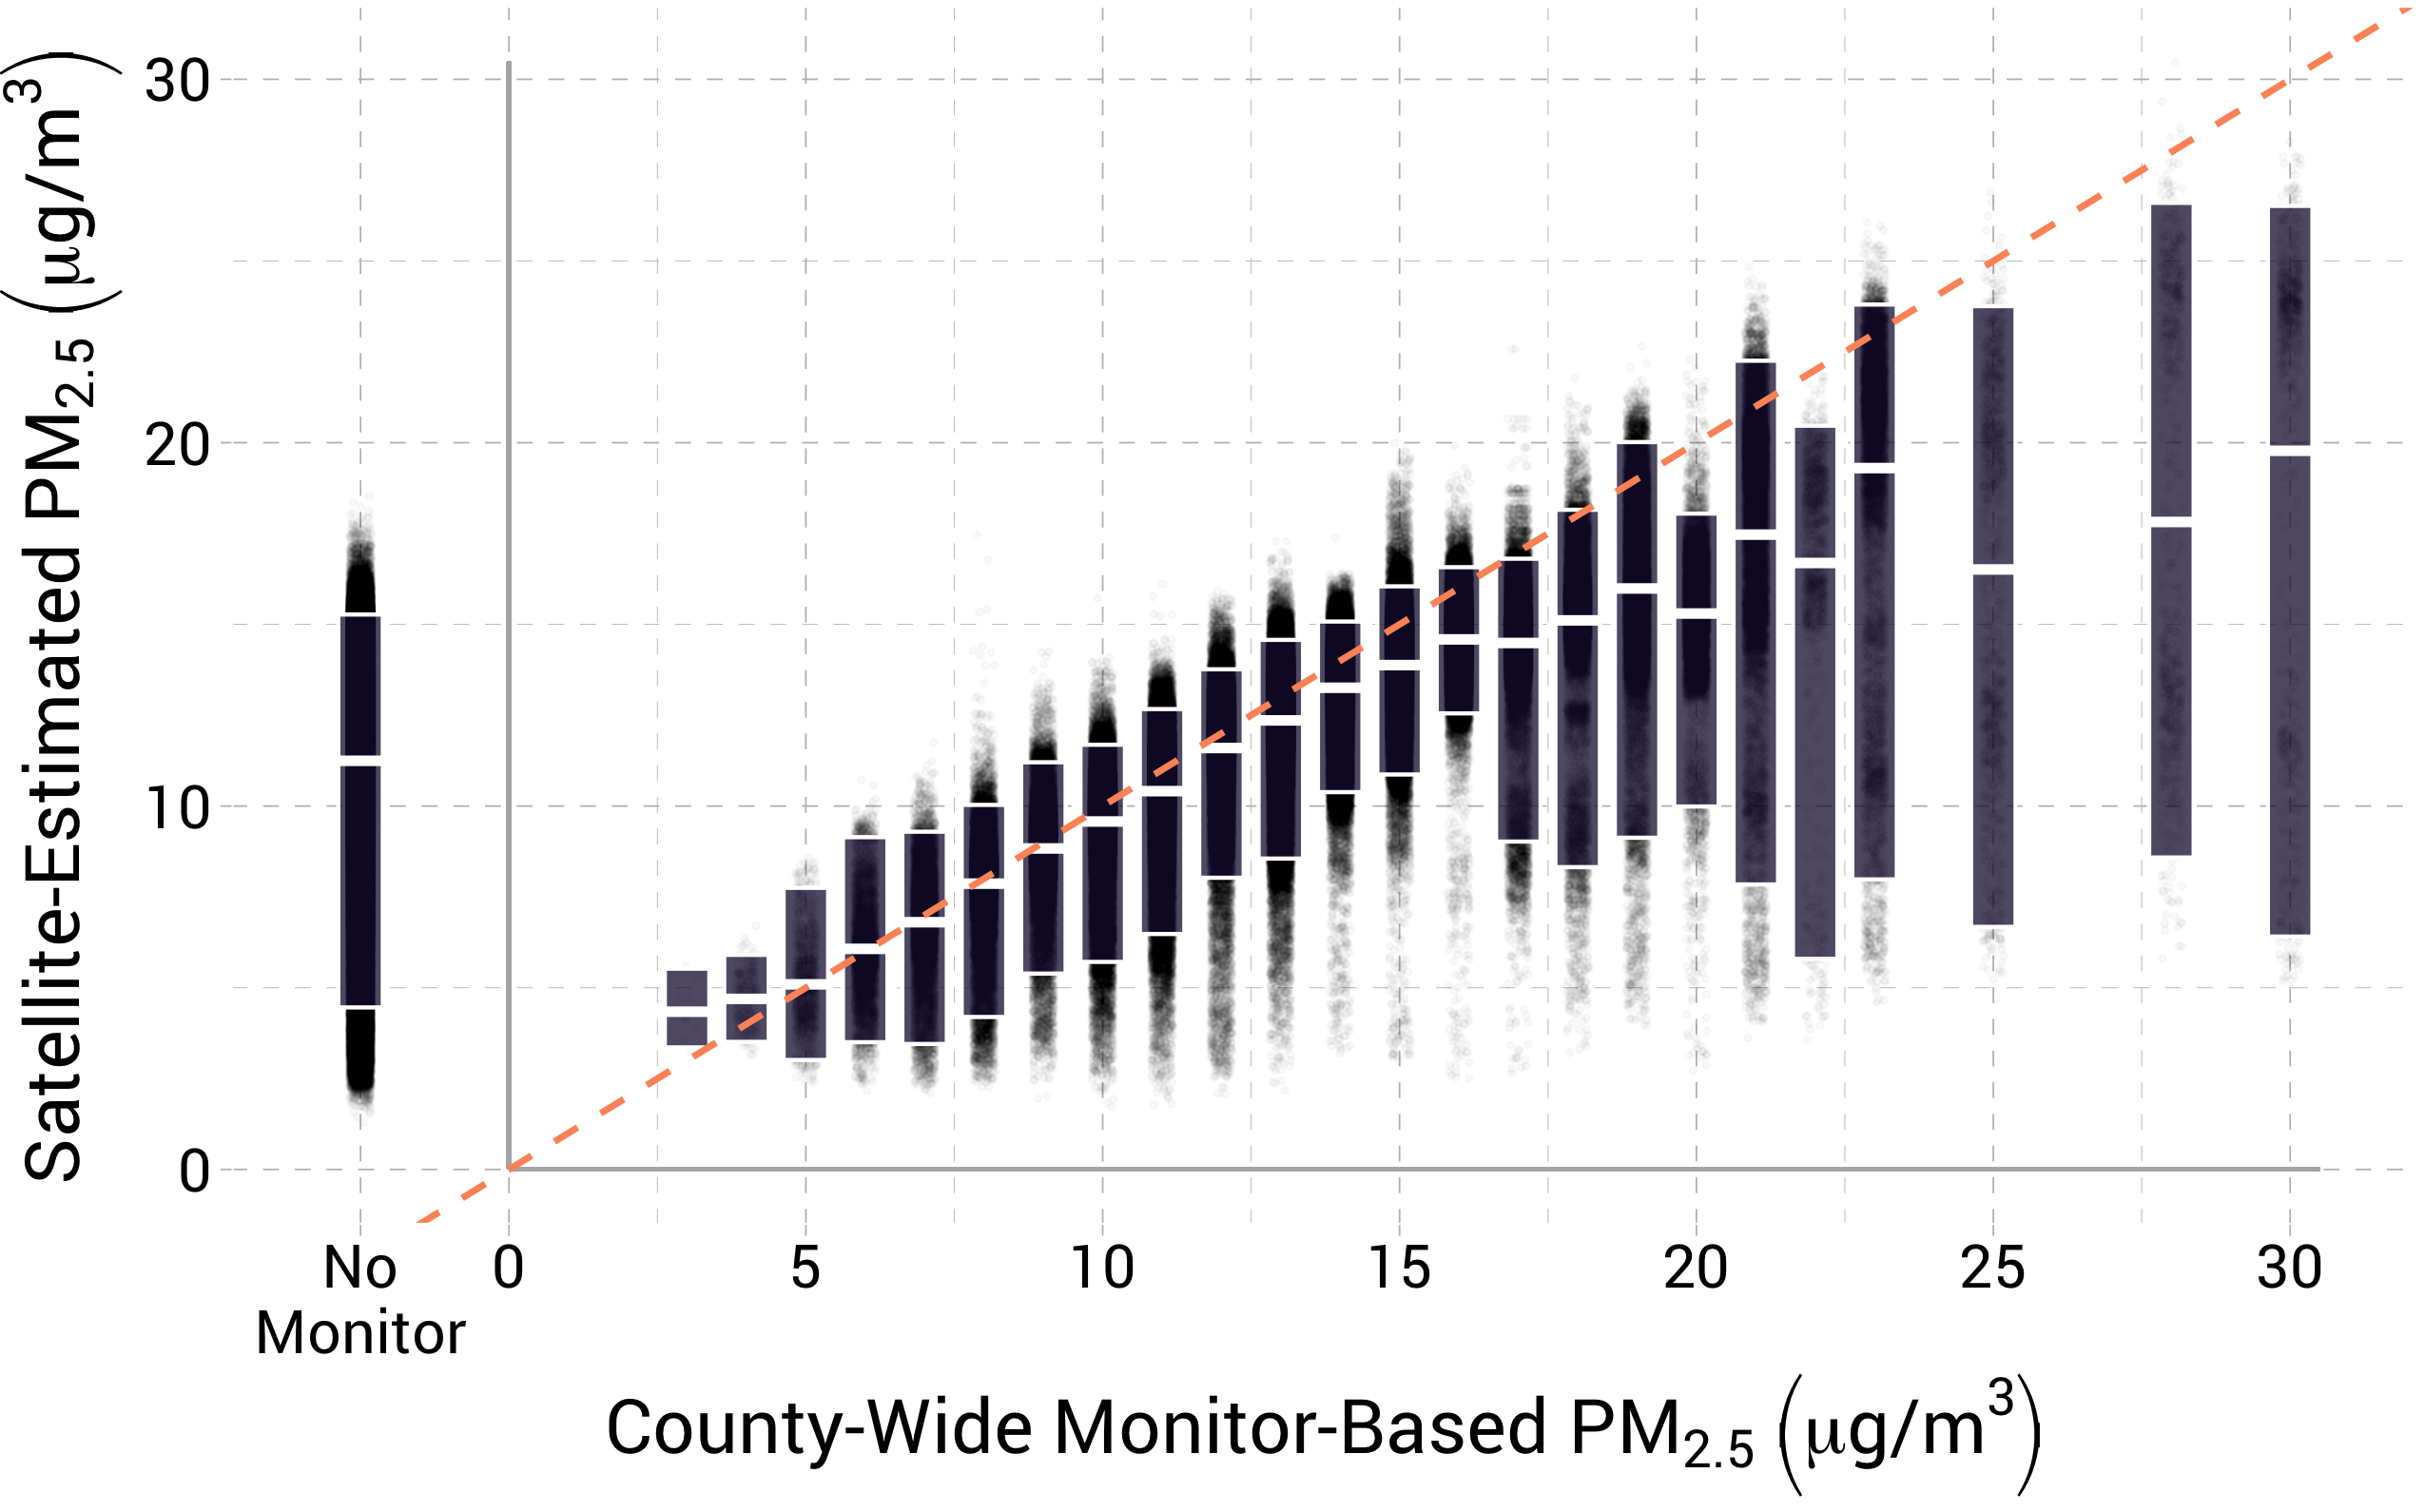
Bringing Satellite-Based Air-Quality Estimates Down to Earth
Meredith Fowlie, Edward Rubin, and Reed Walker. 2019. “Bringing Satellite-Based Air Quality Estimates Down to Earth.” AEA Papers and Proceedings, 109: 283-88. DOI: [10.1257/pandp.20191064
We use state-of-the-art, satellite-based PM2.5 estimates to assess the extent to which the EPA’s existing, monitor-based measurements over- or under-estimate true exposure to PM2.5 pollution. Treating satellite-based estimates as truth implies a substantial number of “policy errors”—over-regulating areas that comply with air quality standards and under-regulating other areas that appear to violate standards. We investigate the health implications of these apparent errors and highlight the importance of accounting for prediction error in satellite-based estimates. Uncertainty in “policy errors” increases substantially when we account for these underlying prediction errors.
Published (P&P) version | NBER Working Paper No. 25560 | EI @ Haas Working Paper 300
books
Data Science for Public Policy
Jeffrey Chen, Edward Rubin, and Gary Cornwall
This textbook presents the essential tools and core concepts of data science to public officials, policy analysts, and economists among others in order to further their application in the public sector. An expansion of the quantitative economics frameworks presented in policy and business schools, this book emphasizes the process of asking relevant questions to inform public policy. Its techniques and approaches emphasize data-driven practices, beginning with the basic programming paradigms that occupy the majority of an analyst’s time and advancing to the practical applications of statistical learning and machine learning. The text considers two divergent, competing perspectives to support its applications, incorporating techniques from both causal inference and prediction. Additionally, the book includes open-sourced data as well as live code, written in R and presented in notebook form, which readers can use and modify to practice working with data.
working papers
Does time shift behavior? The clock- vs. solar-time tradeoff
Patrick Baylis, Severin Borenstein, and Edward Rubin
Revise & resubmit, Journal of Economic Behavior & Organization
Standardized clock-time is perhaps the most ubiquitous behavioral nudge on the planet. It helps schedule and coordinate economic behavior but also creates tension when it shifts activities away from their locally optimal solar-time. Debates about daylight saving time and areas switching time zones center on this tension. We directly measure the clock- vs. solar-time tradeoff using geolocated data on online behavior (Twitter), commute departures (Census), and foot traffic (SafeGraph). A one-hour change in the wedge between solar-time and clock-time shifts behavior 15–27 minutes, with larger effects in northern latitudes and for activities occurring closer to sunrise.


NBER Working Paper No. 30999 | Current draft
Blog: Does Anybody Really Care What Time It Is?
Coverage: NBER Digest | Financial Post
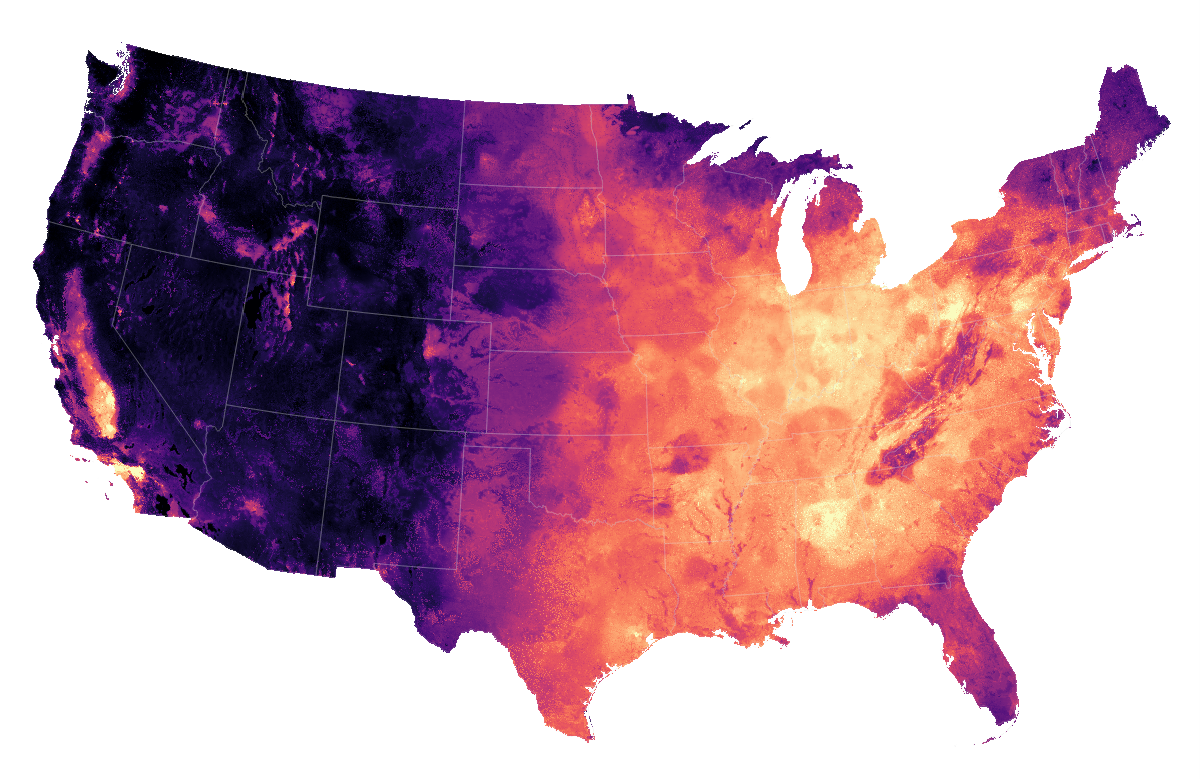
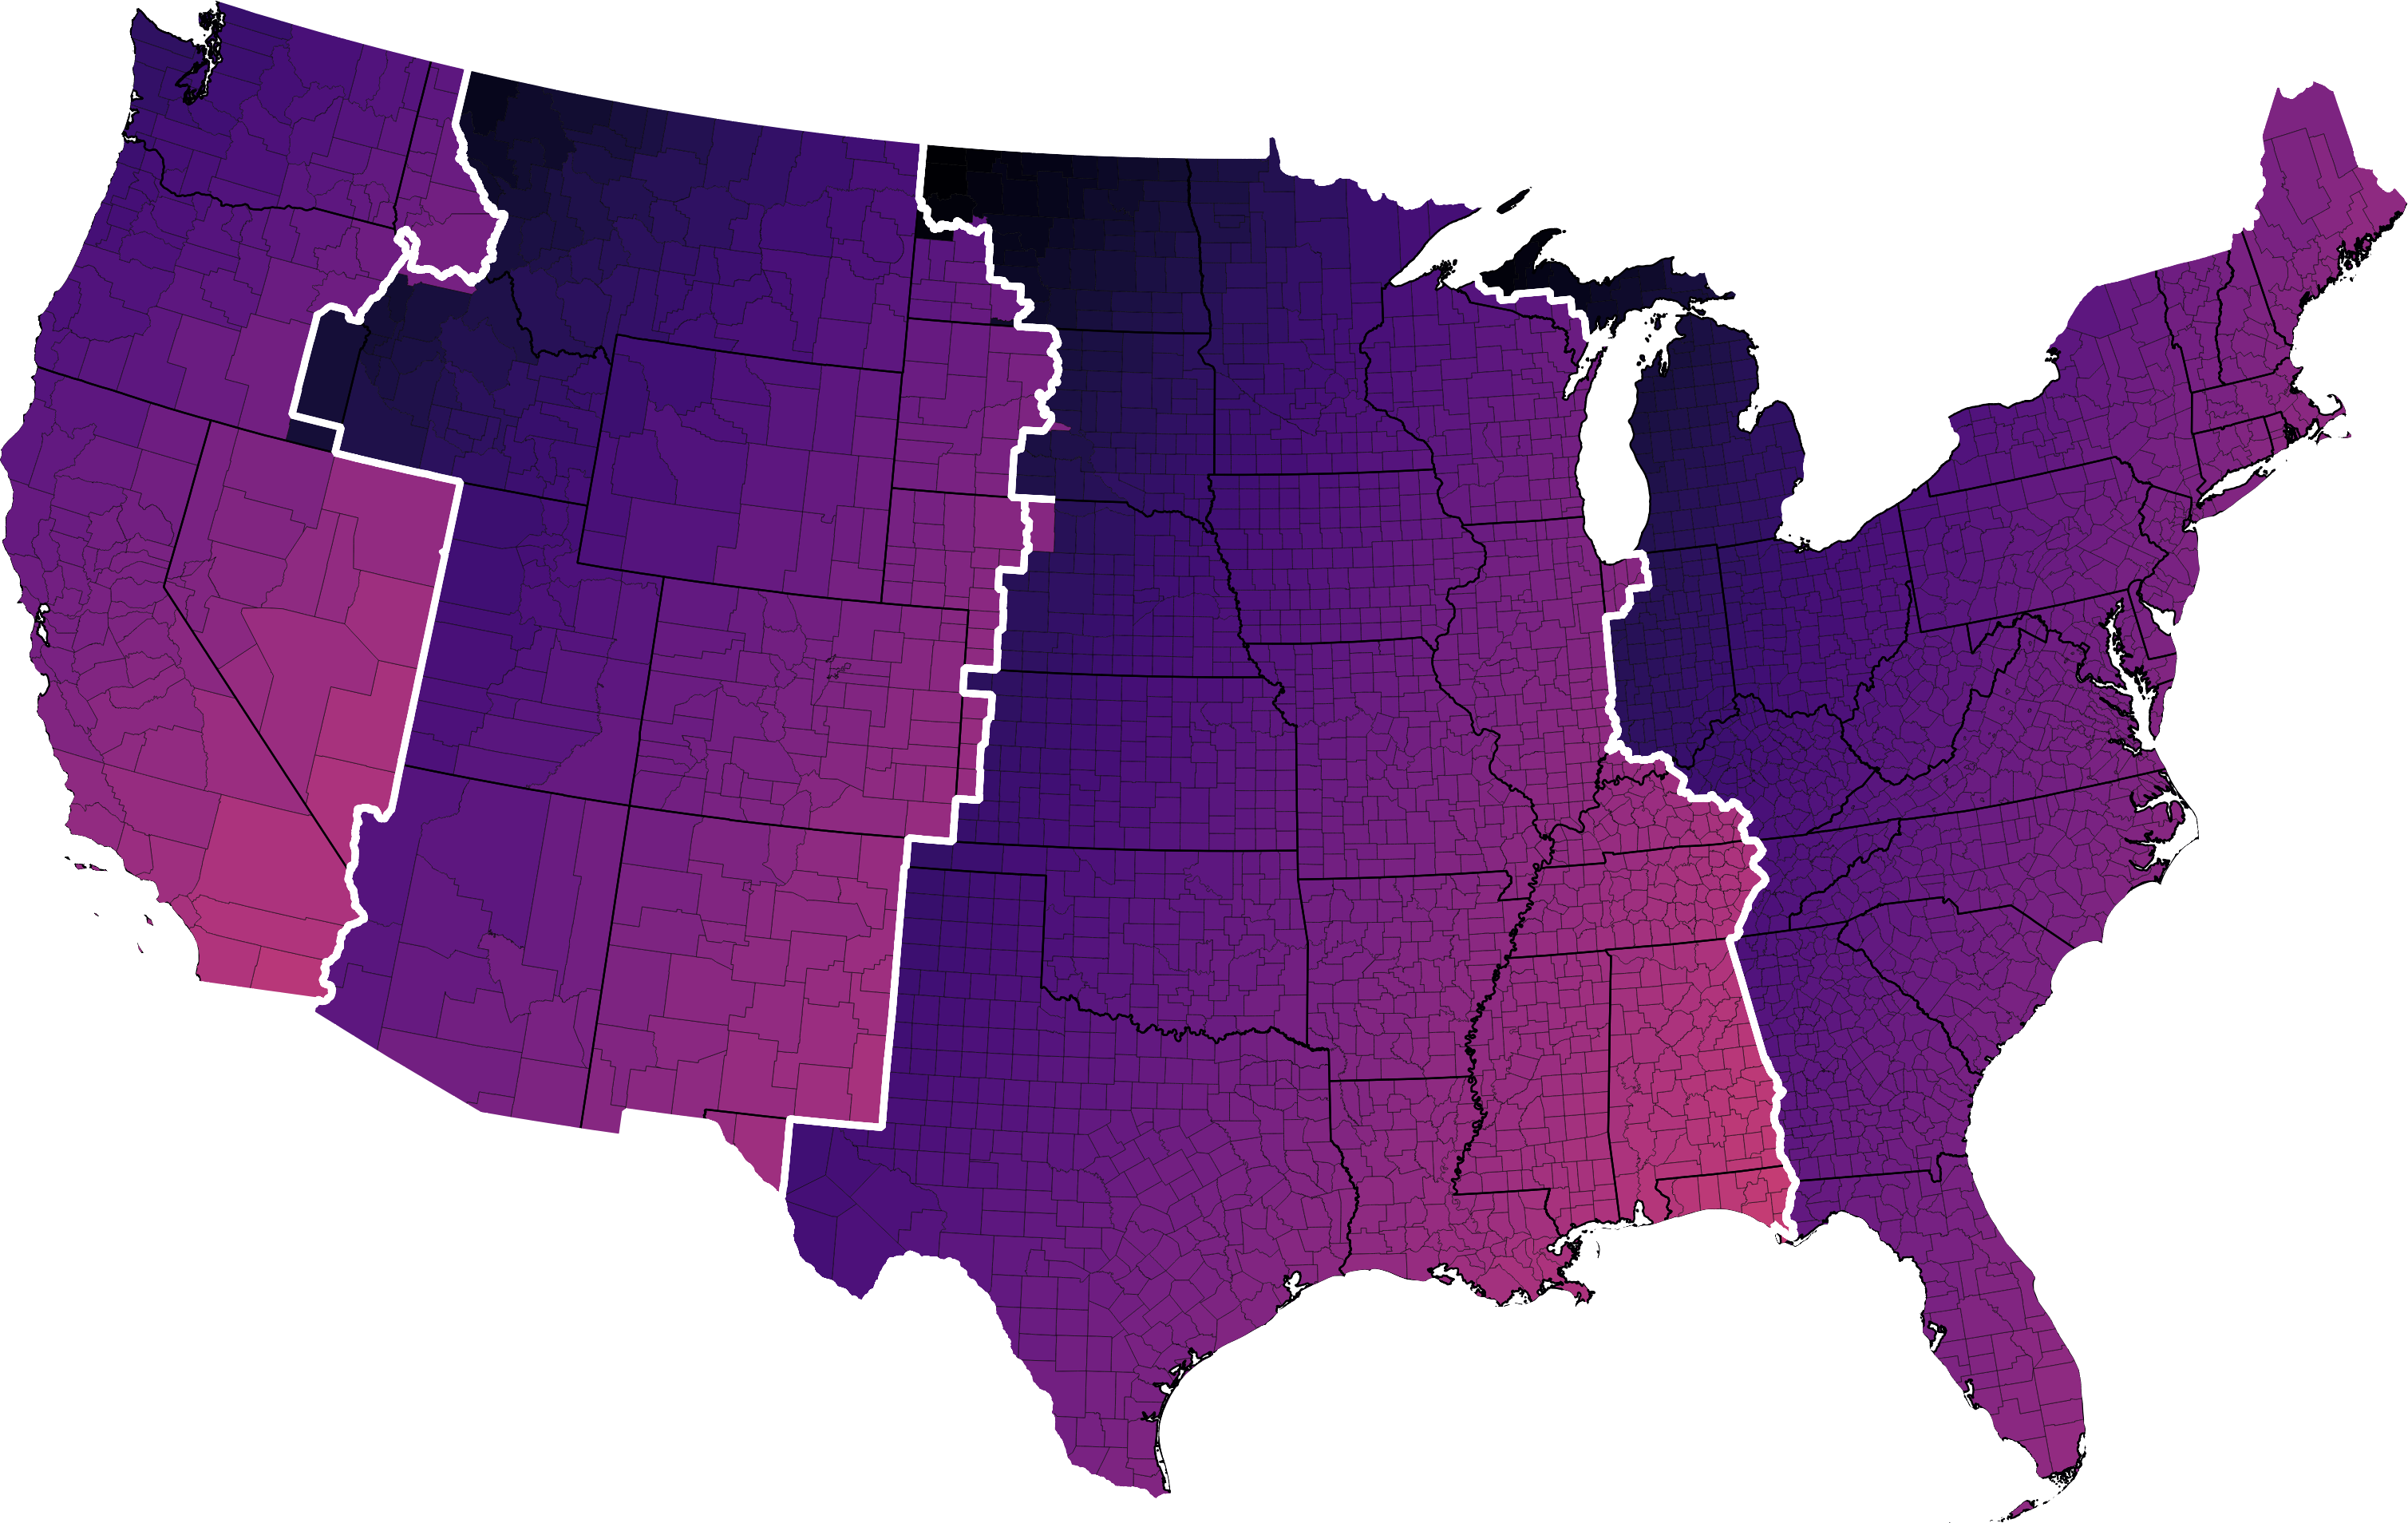
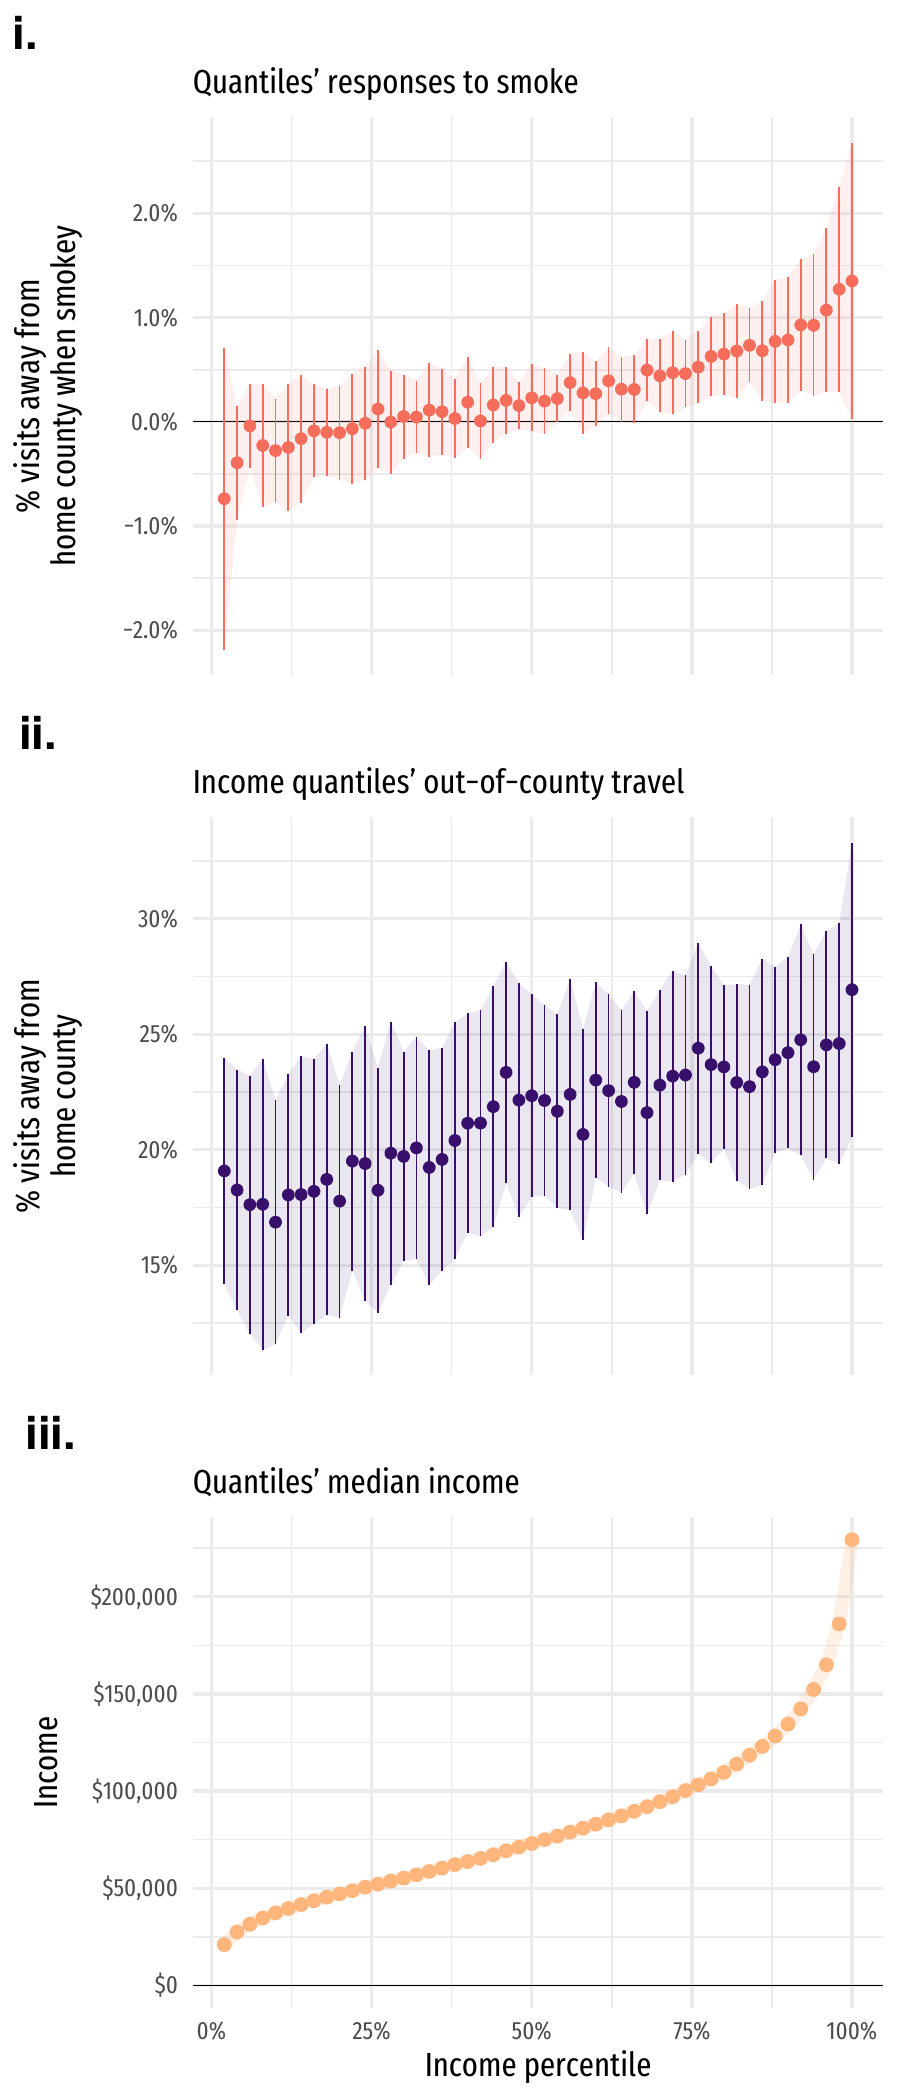
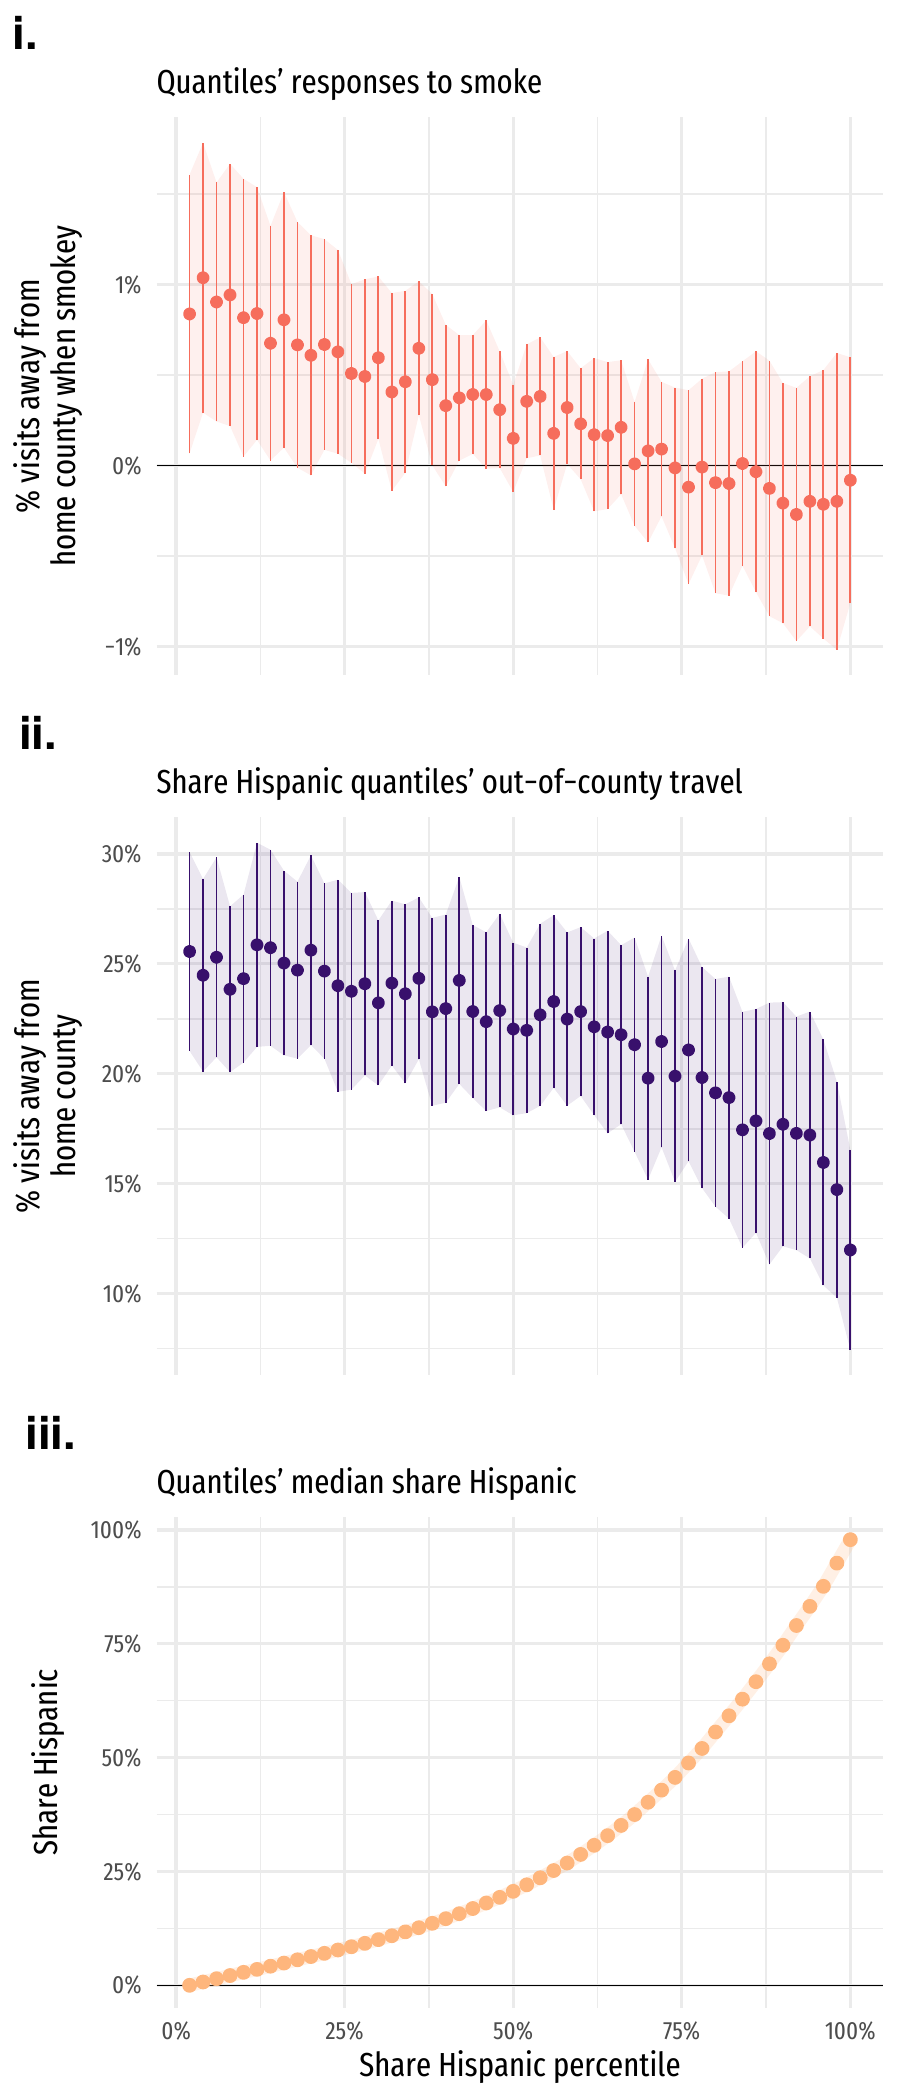
Who flees wildfire smoke? Income and racial disparities in temporary relocation
Edward Rubin and M. Steven Holloway
Submitted
Individuals can reduce risk exposure through short-term avoidance, but nothing guarantees equal access to this strategy. We quantify inequity in hazard avoidance in the context of wildfire smoke—a widespread, recurrent, and growing health concern that affects millions of people annually. Our analysis links satellite-derived data on wildfire smoke plumes, anonymized cellphone-based movement covering roughly 3 billion visits, and Census Block Group demographics for all urban communities on the US West Coast (2018–2021). We causally estimate how the onset of wildfire smoke affects temporary out-migration-measured as (i) the share of visits occurring outside the home county and (ii) the 75th percentile of distance traveled—and how these responses vary with communities’ income levels and racial/ethnic composition. On average, communities increase their shares of out-of-county travel when wildfire smoke arrives. However, these averages mask stark disparities. Higher-income, less-Black, less-Hispanic, and more-White communities exhibit large and statistically significant smoke-induced increases in out-migration. In contrast, the lowest-income, most-Black, and most-Hispanic communities show no detectable response. Our findings show that even when communities face equal levels of hazardous exposures, their avoidance responses can be highly unequal—potentially compounding existing environmental, health, and social inequities. These results provide important insights for public policy as communities confront increasingly frequent and severe risks from climate and natural disasters.
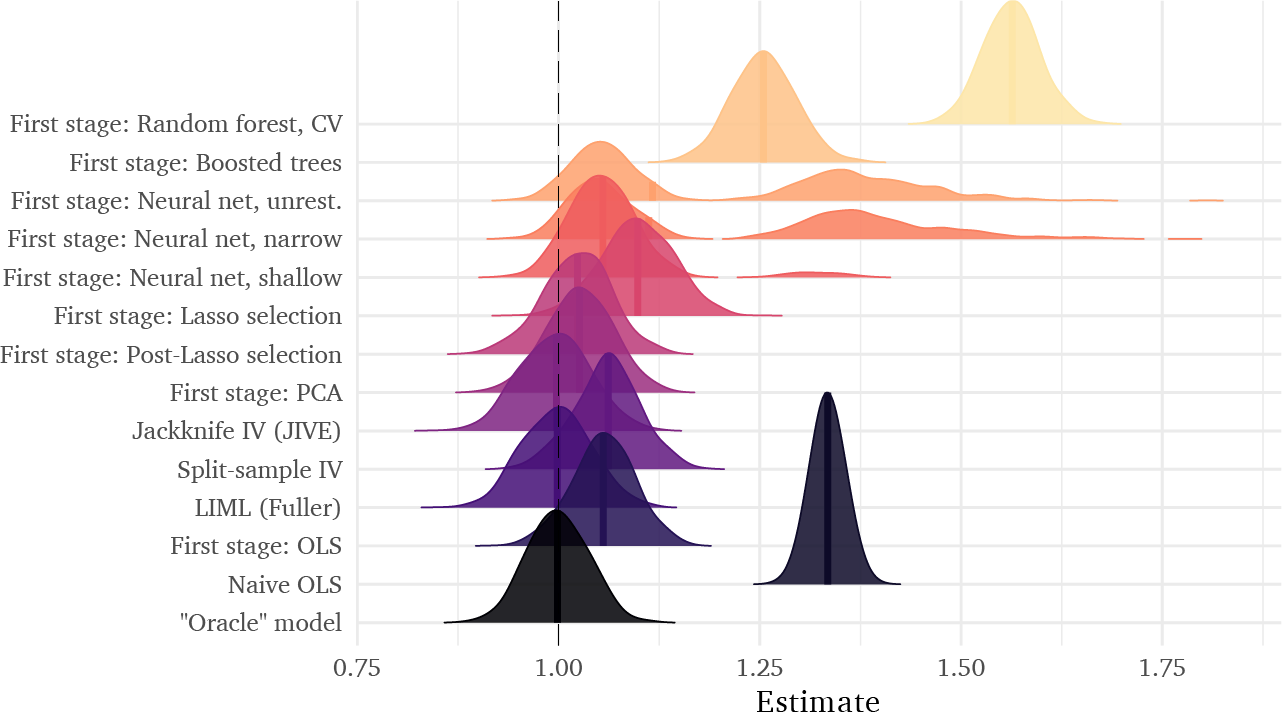
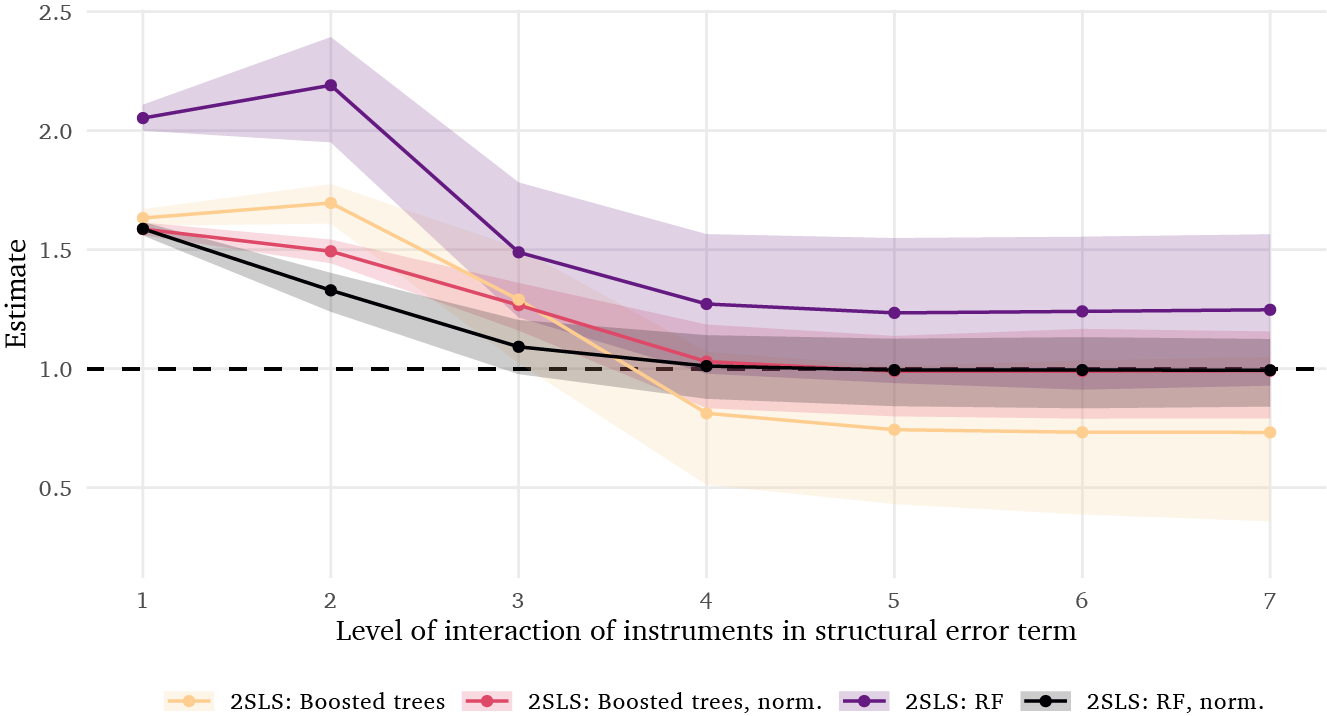
Connor Lennon, Edward Rubin, and Glen Waddell
Machine learning (ML) primarily evolved to solve “prediction problems. The first stage of two-stage least squares (2SLS) is a prediction problem, suggesting potential gains from ML first-stage assistance. However, little guidance exists on when ML helps 2SLS—or when it hurts. We investigate the implications of inserting ML into 2SLS, decomposing the bias into three informative components. Mechanically, ML-in-2SLS procedures face issues common to prediction and causal-inference settings—and their interaction. Through simulation, we show linear ML methods (e.g., post-Lasso) work well, while nonlinear methods (e.g., random forests, neural nets) generate substantial bias in second-stage estimates—potentially exceeding the bias of endogenous OLS.
in progress
Declining power-plant emissions, co-benefits, and regulatory rebound
Meredith Fowlie, Edward Rubin, and Catherine Wright
Environmental prediction for diverse policy contexts
Andrew Dickinson and Edward Rubin
Correlated exposures
Pilar Mullican and Edward Rubin
Mismeasurement in exposure and access: Insights from cellphone data
How salient are environmental risks? The short- and long-run effects of lead exposure in piped water
Are our hopes too high? Testing cannabis legalization’s potential to reduce criminalization
Do aerially applied pesticides affect local air quality? Empirical evidence from California’s San Joaquin Valley